Recessions and Semiconductors
Yes a pod is blowing up somewhere. We are in a regime shift.
Sorry, I have been MIA. I have been in the middle of moving to NYC (just finished) and managing medical issues. This is an update that I will take off a week starting March 27th to recover from an outpatient surgery. But now, on to the update.
The market is quickly pricing in a recession, partially driven by Trump administration policies and meaningful headwinds to the dollar. I will give an armchair macroeconomic summary and discuss semiconductors and what interests me. Let’s start with the macro view, then zoom in closer.
The “Manufacturered” Recession and the 10 Year
Recent comments suggest that the current administration is emphasizing the 10‑year Treasury yield more than stock market levels—a departure from past strategies such as the so‑called “Trump put.” In a Fox interview, the repeated reference to an “adjustment period” indicated a shift toward monitoring bond market signals over equity performance.
The primary way this is measured is the 10-year yield. The 10-year is the rate of borrowing that the US government pays, and by lowering this key rate, the affordability of housing or the rate at which consumers can buy cars. Now, “moving” the 10-year is not like raising or lowering interest rates, which is specifically focused on the rates that the Fed loans to banks overnight. The 10-year price is a market-driven price set by auctioning notes to investors willing to purchase government bonds.
Here’s the rub: The 10-year price is not a precise science. No one truly knows how the 10-year move will be, but it is priced by transactions and is believed to be an expression of inflation and real growth in the GDP of the country issuing the bond.
This is a challenge. Tariffs are likely to exert short-term inflationary pressure, and if the 10‑year yield falls to 3%—as some like Bessent have suggested—it may reflect a downward revision of real growth expectations. In such a scenario, the market might be pricing in an economic downturn as a necessary adjustment.
The market is expecting that at this moment. This is the yield curve from one month ago and now. Specifically, the shorter end of the curve is starting to drop. The implication is that the market is quickly pricing in lower short-term rates and a lower federal fund rate. In this case, this is likely not a representation of lower inflation, but rather a weaker economy and the belief that the Fed is not cutting fast enough.
We are seeing this happen in real time. GDPNow, which is a real time econometric forecasting tool, is now predicting that the economy will have a meaningful contraction in Q1. There are technical reasons for this, but this continues to weaken.
Part of this is heavily impacted by net imports, which are subtracted from the GDP calculation. This is partially a front running of tariffs. But under the surface, it’s weakening broadly. The top chart shows the contributions to growth over time and the estimates. Imports are the big contractor, but importantly, the rate of change is also getting worse in most other categories.
The second chart shows further weakness over imports, with weakening residential investment, government spending (expected), and consumer spending. The rate of change is getting much worse, and is similar to the contraction period that happened in 2Q 2022. Here’s the chart for contributions in 2022, which was driven by a massive destocking impact on the economy.
This quickly reverted as inventories normalized. Will the tariff pull-forward be similar to the inventory correction (one-time) after COVID-19, or will it lead to spiraling consumer and business confidence?
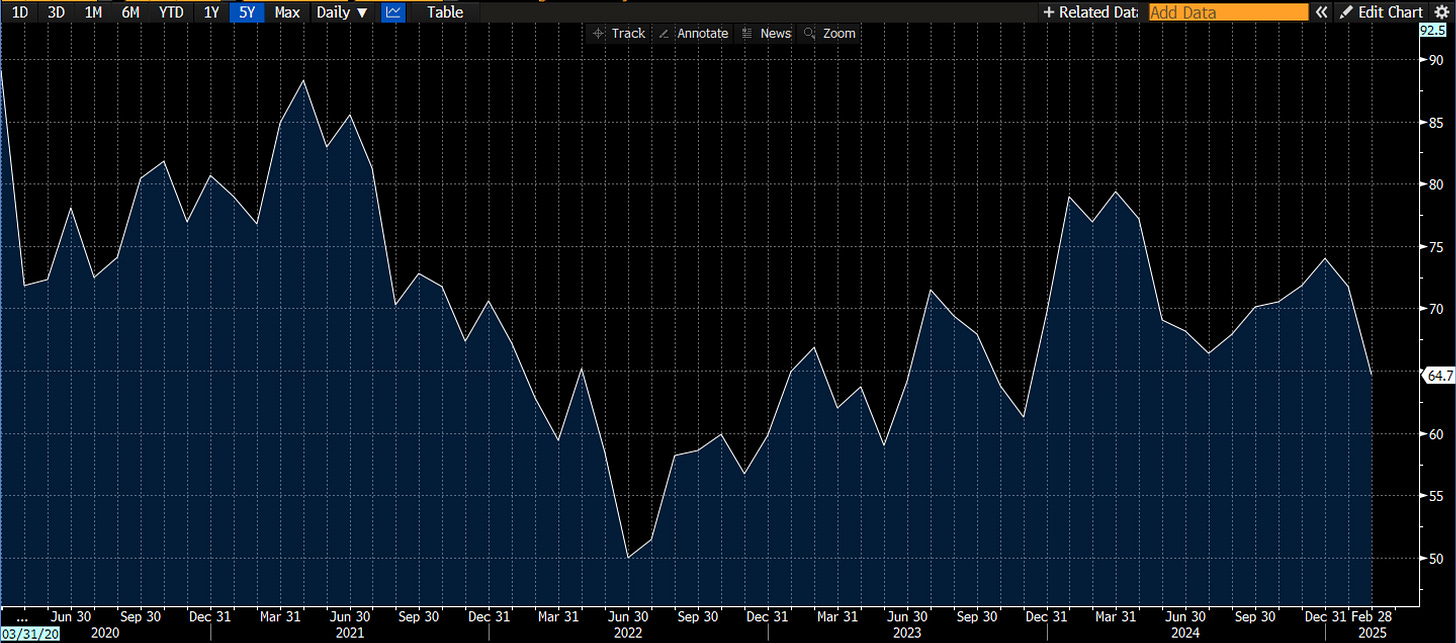
The problem is that consumer confidence is starting to drop, and some of the leading indicators, like the Consumer Confidence Index and the Leading Economic Index, are also starting to drop. The worrying part is that the decline is accelerating. Most economic indicators and spending data points seem to point to further weakness and uncertainty.
So, let’s add that all up. The curve shows increasing economic weakness, declining consumer confidence, and a technical recession, as imports soar. Belief in a weakening economy can have a reflexive impact, as seeing weakness creates savings. Trump is now using the phrase “transition period,” which rarely goes well in markets.
The timing is uncanny. The curve just un-inverted, and that’s almost precisely when the pain begins. When the curve steepens, the correction or recession begins. Put differently, when the yield curve inverts, that predicts a recession. The recession and the impact on stocks start when the yield curve un-inverts. We now see that, with the reversion happening in late September.
We are now seeing the pain. Another critical part of this equation is tariffs and uncertainty because uncertainty in economic terms is pretty much a synonym for volatility. Decisions become more challenging as we are uncertain whether tariff rates are 10, 20, or 25%. But the one overwhelming theme is trade.
Trade Deficits and Asset Flows
The United States consistently runs a significant trade deficit, meaning it imports more than it exports. However, these dollars don’t simply vanish; they are transferred to foreign entities as payments for goods and services. Often, those foreign dollars are recycled back into U.S. financial markets through investments. In this way, a trade deficit is accompanied by capital inflows that help finance U.S. asset purchases.
This creates a natural tailwind for purchasing United States assets with the accumulated dollars of a trade deficit. Think of this as a natural inflow of dollars made by trade.
Now, the thing is, Trump’s policies explicitly focus on trade through tariffs. Tariffs, of course, move up consumers' prices, reducing trade and, with enough tariffs, the deficit. This creates fewer dollars to be recycled in the United States, which creates something pretty bad for asset prices: an outflow.
Increasing tariffs likely means less dollar accumulation from foreign entities, who are already the largest purchasers of assets in the United States. For example, a large Japanese conglomerate that runs a trade surplus with the United States and is now doing less business will purchase fewer assets, including US treasuries. Given that the US treasury primary auction is now facing an outflow, and 24% of treasuries are from foreign investors, this lowers the bid from foreign investors. This raises the 10-year yield. This is now a very tricky situation.
As America increases tariffs and becomes more unfriendly to global trade, it creates a natural asset outflow and, for some foreign entities, a desire to flee US assets. There is a self-fulfilling mechanism that can unwind heavily after decades of a trade deficit. The trade deficit was a natural inflow for a long time. This chart about the US as a percentage of global market cap has gone around over and over - and now there seems to be a way to stop the inflow. And it’s tariffs.
Another uncertainty factor is that the “West” no longer feels unified. The FT is questioning the transatlantic partnership. It’s one thing to park assets in your allies financial markets, it’s another if you’re not that strong of allies anymore. As the United States pulls away and creates reciprocal tariffs reminiscent of Smoot Hawley (literally unilateral tariffs that became a bilateral tariff war with Canada), it’s hard to say allegiances are in a strong spot.
A fracturing of trade is a fracturing of alliances. And as that continues, assets will flee. A vindictive American administration will drive away European trade into the open arms of China, the world’s largest manufacturing base. The previous world order is at risk, and putting all your eggs into one American basket likely doesn’t seem like such a smart strategy anymore. So, where do assets go? So far, Europe has been the biggest beneficiary.
The European and American Flip
There’s an ironic pattern here - the United States and the European Union are weirdly flipping. On the back of significant AI investment announcements and a new potential defense spending, Europe is doing something that it’s long forgone—deficit spending.
Meanwhile, you can argue that cutting costs meaningfully while trying to increase revenue via tariffs is the definition of austerity. This was the strategy Europe pursued after the GFC, and now the roles are starting to flip. Austerity has a horrible track record, while deficit spending created the US dominance and divergence after the GFC.
This is partially why assets are starting to flee, and the biggest divergence of developed-world assets is starting to flow to Europe. The great flow to the US has now reversed, and in the near term, it will first move to large liquid and similar-language assets in Europe. One way to represent this is the IEV (Europe ETF) ratio to the S&P 500 ETF. The trend of American relative outperformance has bucked for 2025, and the pendulum of flows is meaningfully towards the US.
This will be a long tailwind as the tremendous American exceptionalism trade unwinds. Another way to make this happen sooner is for American asset prices to fall quickly while the rest of the world does less badly.
But honestly - this is a semiconductor newsletter, not a macro one. Most of the dynamics mentioned here are relatively consensus macro-economic views and ones that are quickly being priced in. The reality is that significant shifts in the market take time, and the market is quickly pricing the end outcome. This might be drastic.
Market Dynamics and Semiconductors
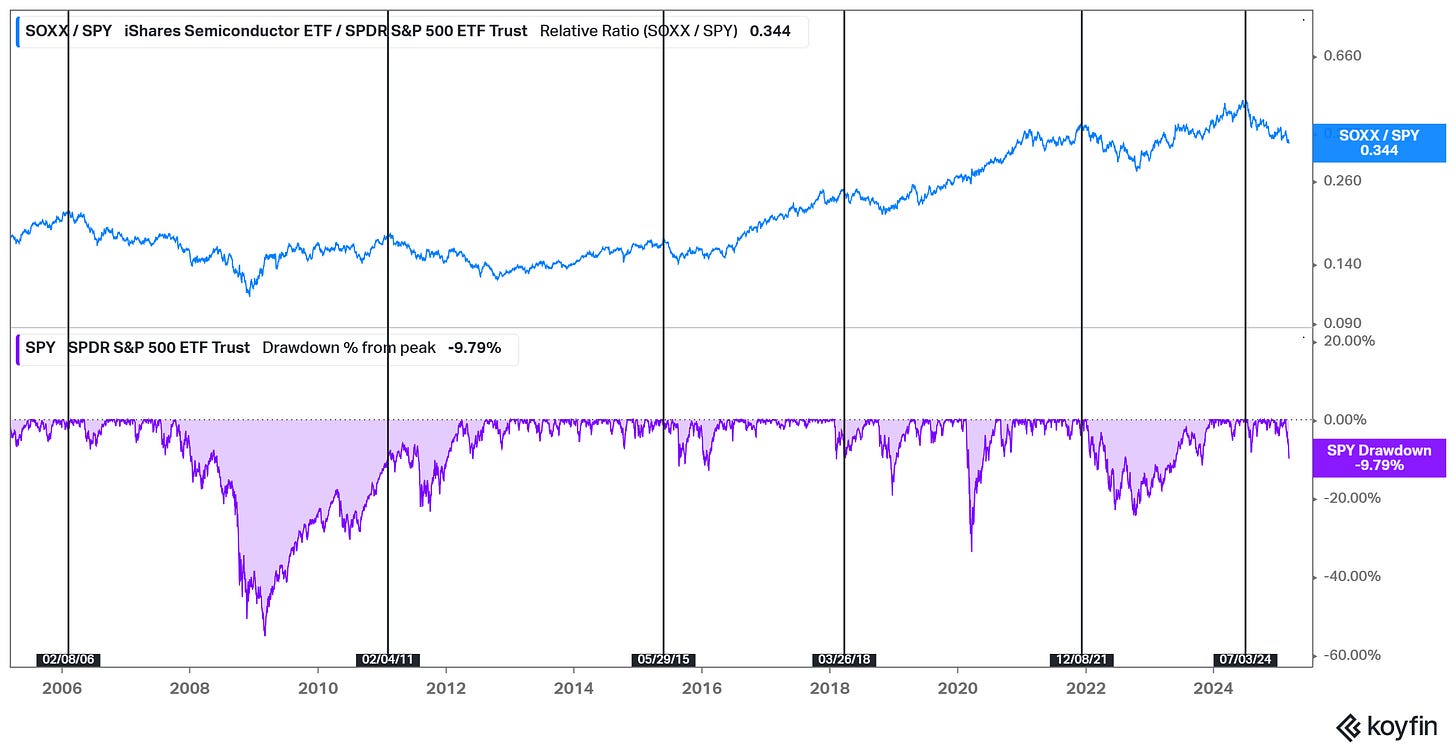
I now come to my beloved semiconductors. I want to make some observations and probably have some paid observations. First, the market top-out is very reminiscent of most market declines. There’s an ancient adage that semiconductors lead the market, and in my observed experience, it’s been true.
The chart below explains that the market often has a meaningful correction in the following months when semiconductors stop their relative outperformance run.
But Semiconductors are cyclical. We have already been in the drawdown, but if the S&P has a 10% drawdown, its pretty typical for semiconductors to have a 20% drawdown. A 20%? 40% drawdown. The market is telling us the health of the economy is weak, and that is a forward-looking indicator that changes orders and the future revenue growth of semiconductor companies.
Now, the question here is how big of a drawdown? We just saw the 10% drawdown number, which aligns with history. Drawdowns typically take a bit more time but are usually more drastic than this. Given the 2022 growth scares were good enough to get a 20% decline in the market, I think that’s where this drawdown likely ends. The growth scares this time are much more substantial than in 2022.
Will it be a recession? That’s outside of my prediction window. But it’s clear there are economic reasons to be uncertain, trade headwinds, and flows that likely move outside of the US. At the very least, we are in a regime change. An adjustment period might just be a correction and economic contraction. I have a smattering of thoughts behind the paywall as well.


